From one in ten to one in two: the arithmetic behind the forecast
Analyst forecasts now put agentic capability in half of all video analytics by 2030, up from under a tenth today. A latency budget and a utility function explain why the curve bends where it does.
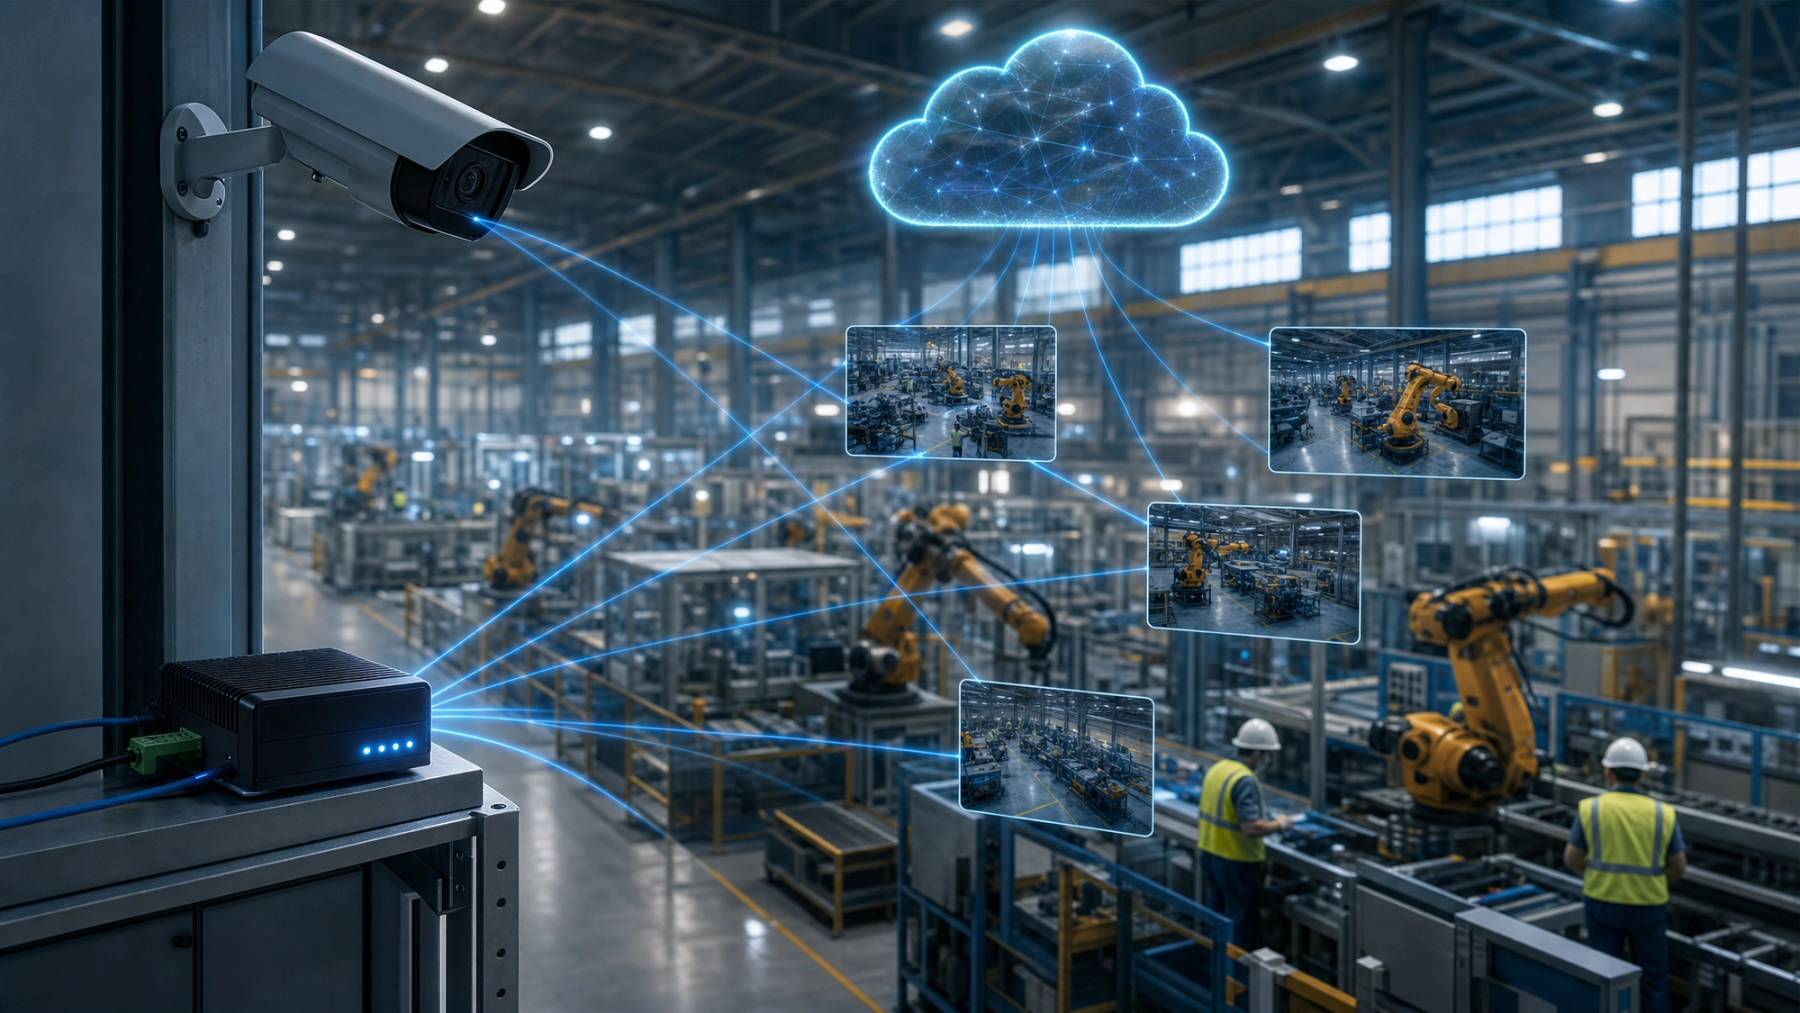
A forecast circulating among enterprise buyers this year says that by 2030, half of all video analytics applications will include agentic capability, up from fewer than one in ten in 2026. A companion projection has three quarters of enterprise computer-vision deployments moving from passive perception to autonomous workflows by 2029, from under a fifth today.
Forecasts of this kind are usually read as ambition. This one is better read as arithmetic, because two equations in Rish Gupta's essay on cameras as digital workers describe the mechanism, and they are worth working through.
The latency budget
The first is a sum. For any agent that acts on what a camera sees, the time from photons to consequence is
PALB = t(capture) + t(encode) + t(infer) + t(decide) + t(actuate) + t(network)
PALB stands for perception-action latency budget. Each term is a real cost. A frame has to be captured and compressed, a model has to run, a decision has to be made, a relay or an API has to fire, and the whole thing has to cross a network at least once. Gupta's essay puts the acceptable total for most security work at one to two seconds. For robotics it is 50 to 200 milliseconds. For a robot arm on a line, tighter still.
The budget decides where software lives. Anything with a tight budget runs on the edge, next to the camera. Anything with a loose budget, such as summarising a shift or weighing a scene against a written policy, can go to a large model in the cloud and wait a few seconds for the answer. The hybrid architecture that most vendors have converged on is not a preference. It falls out of the sum.
The utility function
The second equation is a ratio. The value of a video agent, in the essay's notation, is
U(a) = f(P(t), R(t), 1/L(t))
where P is perception accuracy, R is reasoning depth, and L is action latency, all improving with time t. Utility rises with the first two and falls as latency rises. An application becomes viable at the moment today's P, R and L clear its particular bar.
That is what makes the adoption curve steep rather than linear. Security cleared the bar first because the bar was low: the incumbent was a person watching forty screens and sifting alerts of which, by vendors' own admission, more than nine in ten are harmless. A two-second delay and 80 percent accuracy beat that easily. Manufacturing process control needs higher P and lower L, so it comes later. Robotics needs all three near their limits, so it comes last.
Plugging in the trajectory
Gupta's essay includes a projected component trajectory. Perception at 65 to 72 percent in 2025, rising to 91 to 96 percent by 2027. Reasoning from 45 to 52 percent to 82 to 93. Speed, the inverse of latency, from roughly a third to three quarters or better. Composite utility from under half to something approaching nine in ten. These are estimates, and the essay labels them as such. But they explain the shape of the analyst curve. When each input improves by a large fraction in two years, the number of applications that cross their threshold does not grow by a large fraction. It multiplies.
What the forecast leaves out
Two things. The first is the artifacts problem: an agent still needs a definition of what good looks like at each site, and that comes from people, not models. The second is trust. A system that fires a false talkdown at a legitimate customer gets switched off, whatever the utility function says. The forecast counts capability shipped. Capability used is a smaller number, and the gap between the two is where the next four years will be decided.